The inspiration came from reading Ryan Maclean's blog post where he reflected on the importance of articulating a process logically through a flowchart. Ryan creates his flowchart using Microsoft Visio which is loved by many including myself. Go check it, it's tea-riffic.
In the Microsoft Office suite there are "siblings." Microsoft Excel was initially released in 1987 and then its adopted younger sibling came into the picture in 1992. These two siblings seem to have gotten closer over the years and have become more advanced.
Today, I'm excited to share with you the power of Microsoft Excel and Microsoft Visio to create data--driven process mapping flowcharts.
Wait, what?
Data-driven process mapping flowcharts. Yeah, exactly.
Watch my vlog and be prepared to be amazed by what you see.
Watch my vlog and be prepared to be amazed by what you see.
Microsoft Excel and Microsoft Visio
Even though I am a Dynamics 365 consultant, I've always supported Microsoft products as I grew up with it in my household. My dad taught me Microsoft Excel when I was little and eventually I came across Microsoft Visio in highschool. I never thought I'd be using the two together years later.
Like Ryan, I use Microsoft Visio for what I do as a consultant. If it's available to you, try it out.
My first encounter with the two siblings playing together nicely was back in NZ where I learnt that I can define the shape data and the data graphic to create a Microsoft Visio template file that can link data to the shapes from an Excel spreadsheet.
Back then I used to work as a Sales Administrator for the General Manager of Sales and I created a Sales "pursuit" template that allowed the salesperson to colour code the existing platforms or the targeted to-be platforms of a client. The data was entered in an Excel spreadsheet by the salesperson and all they needed to do was link it to the Microsoft Visio template file. Microsoft Visio then associated the rows to the shapes and the shape formatting kicked in automatically. The sales team then had a visualization of each client they were pursuing.
Fast forward nine years and now you can create data-drive flowcharts from a Microsoft Excel spreadsheet. It's truly amazing and if you've read the Microsoft Business Applications release notes, soon you'll be able to create Microsoft Flows from Microsoft Visio.Like Ryan, I use Microsoft Visio for what I do as a consultant. If it's available to you, try it out.
My first encounter with the two siblings playing together nicely was back in NZ where I learnt that I can define the shape data and the data graphic to create a Microsoft Visio template file that can link data to the shapes from an Excel spreadsheet.
Back then I used to work as a Sales Administrator for the General Manager of Sales and I created a Sales "pursuit" template that allowed the salesperson to colour code the existing platforms or the targeted to-be platforms of a client. The data was entered in an Excel spreadsheet by the salesperson and all they needed to do was link it to the Microsoft Visio template file. Microsoft Visio then associated the rows to the shapes and the shape formatting kicked in automatically. The sales team then had a visualization of each client they were pursuing.
And yes, I am a nerd when it comes to Microsoft Visio in case you hadn't worked that out already 😁
How can I use the export to Microsoft Visio feature from Microsoft Excel?
You need a Visio Online Plan 2 licence with an Office 365 subscription. Below is a screenshot of what the pricing looks like in Australian dollars.Remember, to take advantage of creating Microsoft Flows from Microsoft Visio in the future you will need Visio Online Plan 2.
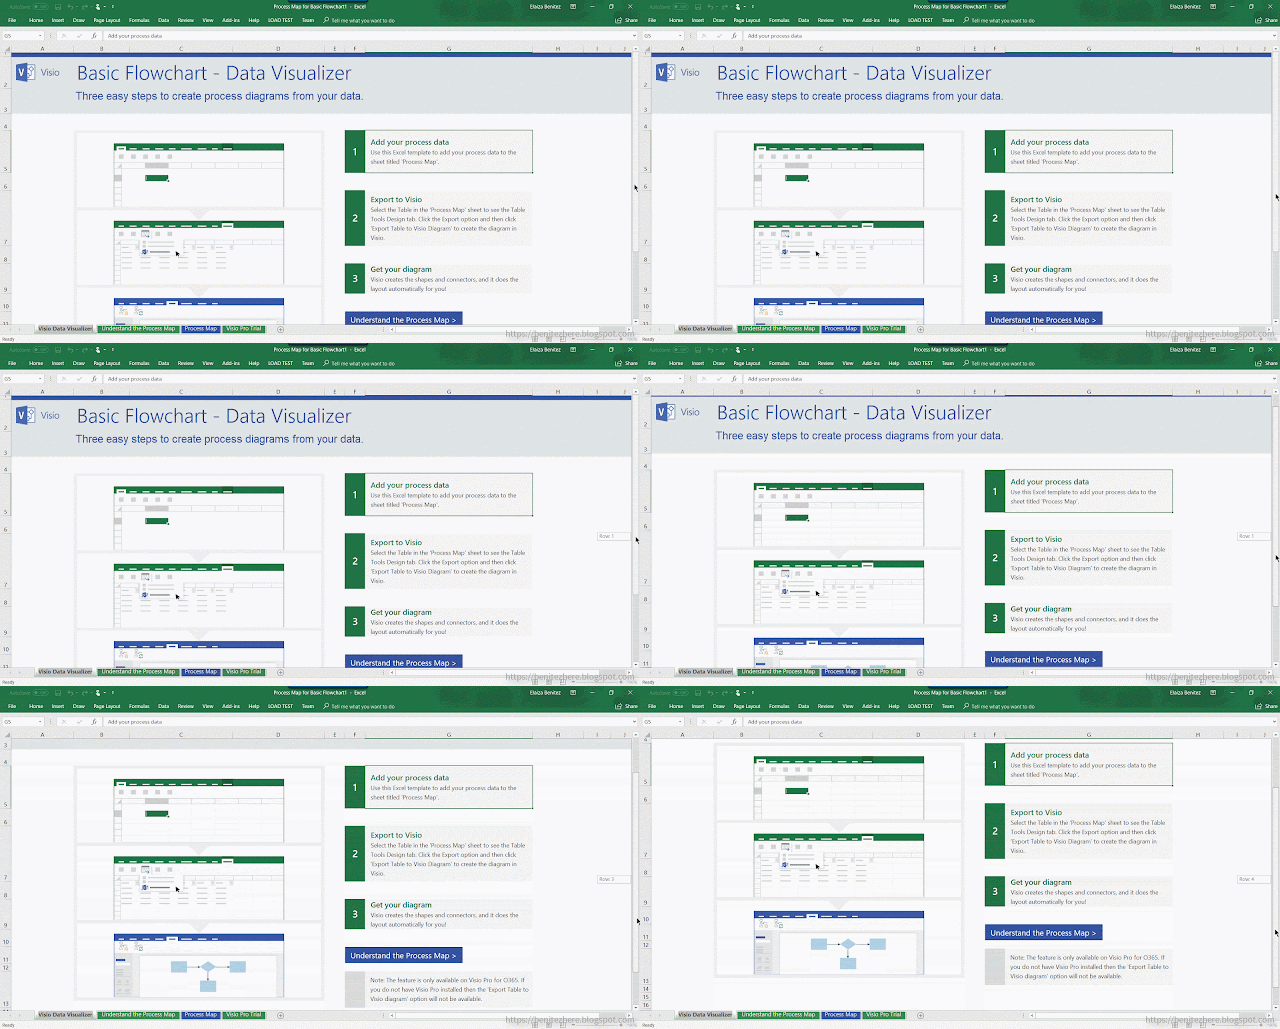
When you open Excel, search for "process" and there will be two templates you can choose from:
- Process Map for Basic Flowchart
- Process Map for Cross-Functional Flowchart
Once the template loads there will be tabs that are self-explanatory.
Visio data visualizer tab
This is an introduction to the template.
Understand the Process Map tab
This will outline what you need to know when entering your process into the table in the third tab.
Basically it tells you what the definitions are in the table. I'm not going to re-write the explanations here as it's straightforward to understand in the tab.
Process Map tab
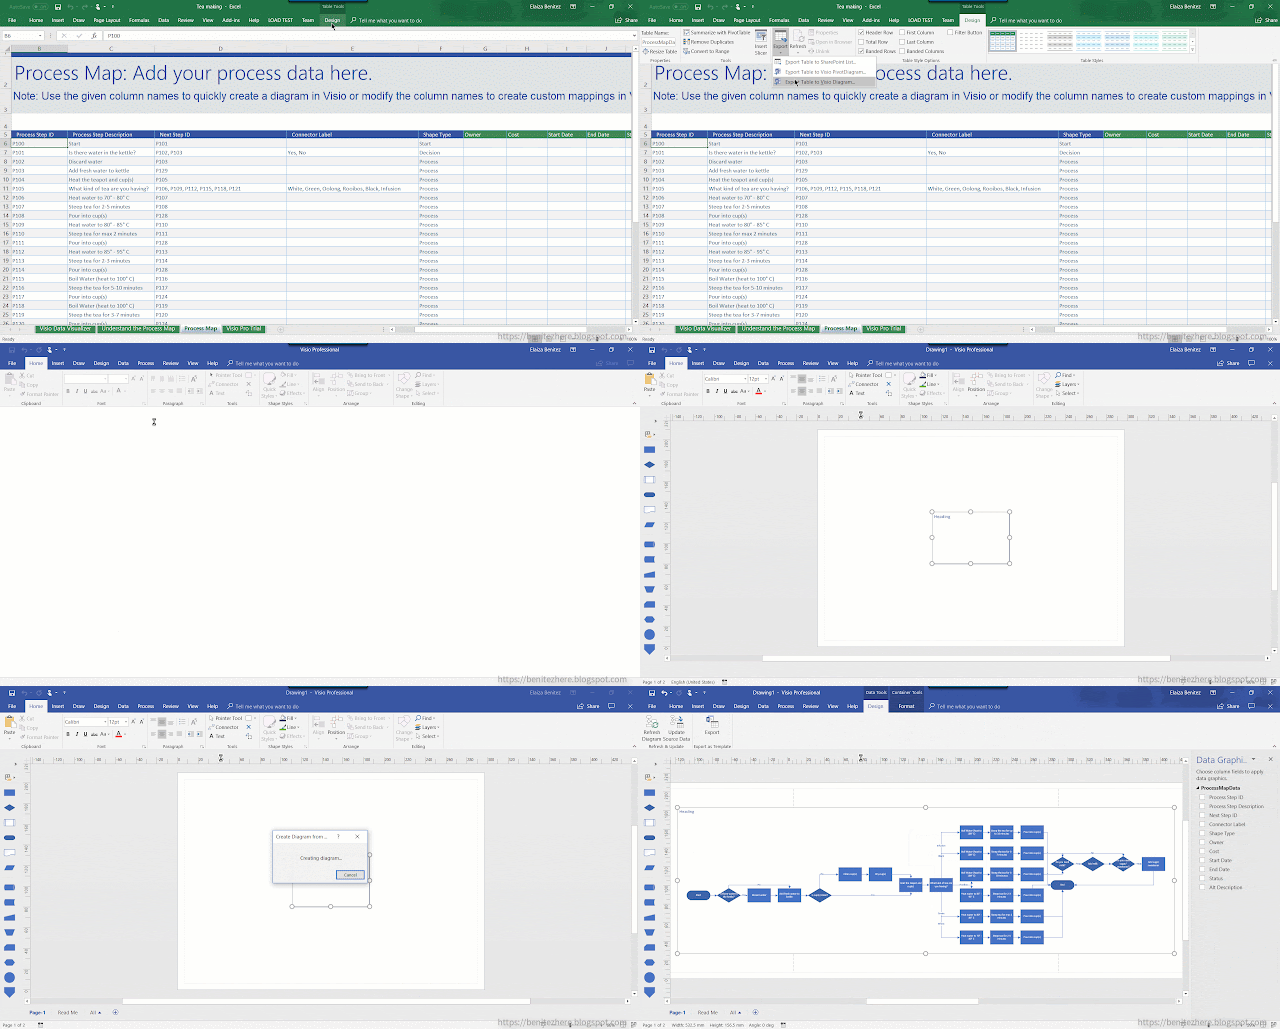
In this tab this where you enter in your process steps. By default there will always be two rows so you need to remember that when you add your steps, the first start step needs to point to the next process step id otherwise it will continue to point to the default "Stop" step.
Ready to have a part-tea in Visio?
Once all your information is entered into the Process Map tab you can now hit the magic button in the Design tab. The magic button is "Export table to Visio Diagram."
Microsoft Visio will then load shortly followed by your flowchart based on the data entered in the Microsoft Excel source file.
You can then adjust
- the positioning of any shapes that look out of line
- the positioning of text
As seen in my vlog, if you insert a new shape into the flowchart in Microsoft Visio, you also have the ability to update the source Microsoft Excel file.
If you also update the source Microsoft Excel file with new process steps by adding new rows, you also have the ability to update the Microsoft Visio flowchart.
Truly amazing what the Microsoft Product Group team has created. Power of Microsoft Excel and Microsoft Visio!
Troubleshooting
I had some trouble installing Microsoft Visio from Office 365 as I had a conflicting version of Office products installed.
I uninstalled through programs and features.
I uninstalled through programs and features.
What to do if you can't install after downloading from Office 365?
In my case, not all the files were uninstalled through program and features. I then had a phone call with Office 365 support to help me through it. Also, Office 365 support was awesome. The lady who helped me was great.She pointed me to this link to run a program to take care of uninstalling all the files for you. I used "Option 2 - Completely uninstall Office 2016 with the easy fix tool."
The next thing I was advised to do is to use the diagnostics tool to install the Office suite first, followed by Microsoft Visio. The rest is magic and it works.
If you didn't know this existed, now you do. It helped me with my installation issues.
There also seems to be a tool available for Dynamics 365 which is interesting. I took a quick peek and looks like you can have assistance with the Dynamics 365 Outlook Client.
What if you can't see the Export table to Visio diagram button as seen in my vlog?
You need to opt in for the monthly channel for the Office 365 suite to make use of the new features available. To do this, you can head over to this link and download the program to help you switch from Semi-Annual Channel to Monthly Channel for the Office 365 suite.
Summary
To create data driven flowcharts from a Microsoft Excel spreadsheet, you need Visio Online Plan 2 to be able to export to Microsoft Visio. You can have two sources of data and whether you update either source, it will always be reflected by its sibling. You may think why have both an Excel spreadsheet and a Microsoft Visio file? Why not only one? Well here's my final thoughts
- the Excel spreadsheet can be handy as it can provide the information in a tabular format
- you may have users who are not familiar with creating flowcharts. They can start with entering the logic into an Excel spreadsheet and then export to Microsoft Visio for the diagram
- for beginners with Microsoft Visio, it's not a bad way to introduce them to it and understand the underlying concept of a flowchart
If you're happy with creating only the Microsoft Visio file, then you can continue to do so. However since I've tried this out, I love it and I know it's going to make my documentation easier.
Watch the original video by the Microsoft Product Group team.
Watch the original video by the Microsoft Product Group team.
Go on. try it out. Indulge in your curiosi-tea. Feel like royal-tea and live in a high socie-tea.
Cool story, bro brew.
Microsoft Excel and Microsoft Visio get oolong well.
OK OK, I'll stop 😂
Toodles.


